import matplotlib.pyplot as plt
import numpy as npSingle Fixed Point Iteration Algorithm
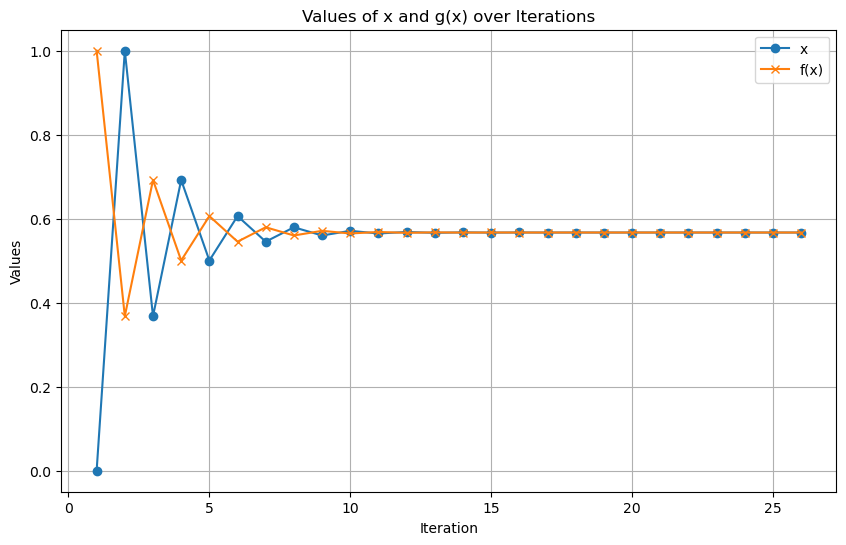
The Single Fixed Point Iteration Algorithm is an iterative numerical method to find fixed points of a function
Algorithm Steps:
  - Start with an initial guess x_0.
  - Calculate the next value: x_{i+1} = g(x_i).
  - If |x_{i+1} - x_i| < tol, consider x_{i+1} as the fixed point.
  - Repeat until convergence or a max number of iterations.
Import Libraries
Function to find the approx root
def single_point_iteration(func, a, tol=1e-6, max_iter=100):
    x = a
    iter_count = 1
    x_next = np.inf

    iteration_data = []

    print("Iteration |    x     |    g(x)  |   Ea (%)")
    print("-----------------------------------------")

    while abs(x_next - x) > tol and iter_count <= max_iter:
        iteration_data.append([iter_count,x,func(x)])
        x_next = x
        x = func(x)
        Ea = abs((x - x_next) / x) * 100

        print(f"{iter_count:9d} | {x:.6f} | {func(x):.6f} | {Ea:.3f}")

        iter_count += 1

    return x_next , np.array(iteration_data)
Defining the Fxn
\[ f(x)=0 \] \[ \large x = g(x) \]
def function(x):
    return np.exp(-x)
Initializing the variables
a = 0.0
tolerance = 1e-6
FInding the approx value
root,iteration_data = single_point_iteration(function, a, tol=tolerance)
print("")
print("Approximate root of g(x):", root)
print("Function value f(x) at root:", function(root)-root)
Iteration | x | g(x) | Ea (%)
-----------------------------------------
1 | 1.000000 | 0.367879 | 100.000
2 | 0.367879 | 0.692201 | 171.828
3 | 0.692201 | 0.500474 | 46.854
4 | 0.500474 | 0.606244 | 38.309
5 | 0.606244 | 0.545396 | 17.447
6 | 0.545396 | 0.579612 | 11.157
7 | 0.579612 | 0.560115 | 5.903
8 | 0.560115 | 0.571143 | 3.481
9 | 0.571143 | 0.564879 | 1.931
10 | 0.564879 | 0.568429 | 1.109
11 | 0.568429 | 0.566415 | 0.624
12 | 0.566415 | 0.567557 | 0.356
13 | 0.567557 | 0.566909 | 0.201
14 | 0.566909 | 0.567276 | 0.114
15 | 0.567276 | 0.567068 | 0.065
16 | 0.567068 | 0.567186 | 0.037
17 | 0.567186 | 0.567119 | 0.021
18 | 0.567119 | 0.567157 | 0.012
19 | 0.567157 | 0.567135 | 0.007
20 | 0.567135 | 0.567148 | 0.004
21 | 0.567148 | 0.567141 | 0.002
22 | 0.567141 | 0.567145 | 0.001
23 | 0.567145 | 0.567142 | 0.001
24 | 0.567142 | 0.567144 | 0.000
25 | 0.567144 | 0.567143 | 0.000
26 | 0.567143 | 0.567143 | 0.000
Approximate root of g(x): 0.5671437480994115
Function value f(x) at root: -7.172651695919185e-07Plotting the values
plt.figure(figsize=(10, 6))
plt.plot(iteration_data[:,0], iteration_data[:,1], marker='o', label='x')
plt.plot(iteration_data[:,0], iteration_data[:,2], marker='x', label='f(x)')
plt.xlabel('Iteration')
plt.ylabel('Values')
plt.title('Values of x and g(x) over Iterations')
plt.legend()
plt.grid(True)
plt.show()