import matplotlib.pyplot as plt
import numpy as npSecant Method
Secant Method is also an iterative numerical method to find fixed points of a function
Algorithm Steps:
- Start with two initial guesses, x_0 and x_1.
- For i = 2, 3, ... until convergence or max iterations:
- Calculate the function values at x_i and x_{i-1}: f(x_i) and f(x_{i-1}).
- Calculate the next approximation using the secant formula:
\[ x_{i+1} = x_i - f(x_i) \frac{(x_i - x_{i-1})}{(f(x_i) - f(x_{i-1}))} \] - If |x_{i+1} - x_i| < tol or |f(x_{i+1})| < tol, consider x_{i+1} as the root and exit the loop.
Import Libraries
Function to find the approx root
def secant_method(func, x0, x1, tol=1e-6, max_iter=100):
    iter_count = 0
    x_prev = x0
    x_curr = x1

    iteration_data = []
    print("Iteration |  x_curr  |   x_next | f(x_curr) |   Ea (%)")
    print("---------------------------------------------------------")
    print(f"{iter_count:9d} | {x_prev:.6f} | {x_curr:.6f} | {func(x_prev):.6f}")

    while abs(x_curr - x_prev) > tol and iter_count < max_iter:
        f_curr = func(x_curr)
        f_prev = func(x_prev)

        x_next = x_curr - (f_curr * (x_curr - x_prev)) / (f_curr - f_prev)
        Ea = abs((x_next - x_curr) / x_next) * 100

        iteration_data.append([iter_count + 1, x_curr, x_next, f_curr, Ea])

        print(f"{iter_count + 1:9d} | {x_curr:.6f} | {x_next:.6f} | {f_curr:.6f} | {Ea:.3f}")

        x_prev = x_curr
        x_curr = x_next

        iter_count += 1

    return x_curr, np.array(iteration_data)
Defining the Fxn
def function(x):
    return np.exp(-x)-x
Initializing the variables
initial_guess1 = 2.5
initial_guess2 = 3.5
tolerance = 1e-6
FInding the approx value
root, iteration_data = secant_method(function, initial_guess1, initial_guess2, tol=tolerance)
print("")
print("Approximate root:", root)
print("Function value at root:", function(root))
Iteration | x_curr | x_next | f(x_curr) | Ea (%)
---------------------------------------------------------
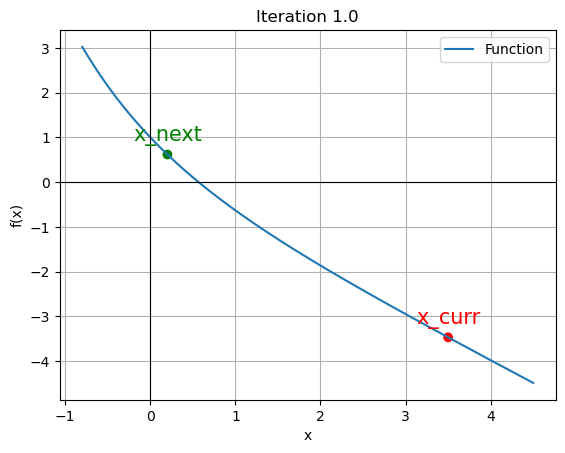
0 | 2.500000 | 3.500000 | -2.417915
1 | 3.500000 | 0.201356 | -3.469803 | 1638.214
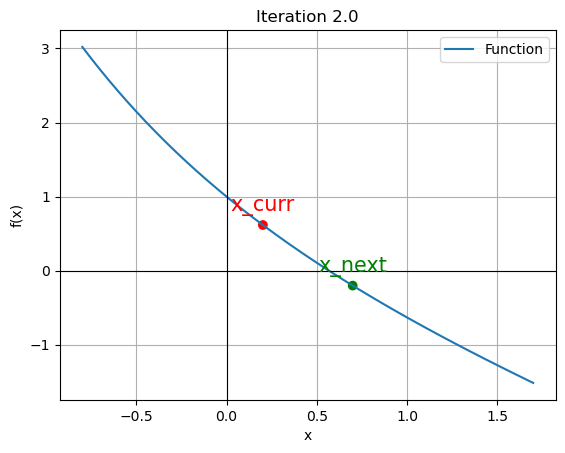
2 | 0.201356 | 0.698861 | 0.616265 | 71.188
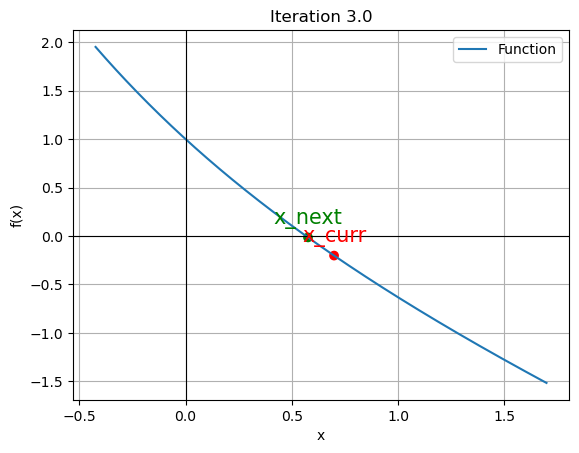
3 | 0.698861 | 0.576178 | -0.201710 | 21.293
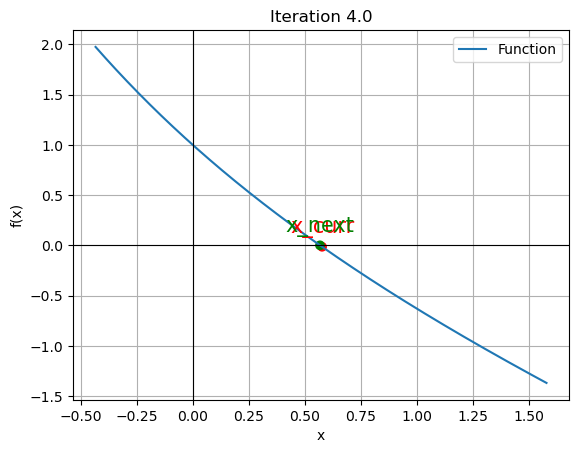
4 | 0.576178 | 0.566933 | -0.014136 | 1.631
5 | 0.566933 | 0.567144 | 0.000330 | 0.037
6 | 0.567144 | 0.567143 | -0.000001 | 0.000
Approximate root: 0.5671432904228986
Function value at root: -2.055255965416336e-11for data in iteration_data[:4]:
iter_count, x_curr, x_next, f_curr, Ea = data
plt.figure()
x_vals = np.linspace(min(x_curr, x_next) - 1, max(x_curr, x_next) + 1, 400)
y_vals = function(x_vals)
plt.plot(x_vals, y_vals, label='Function')
plt.scatter([x_curr, x_next], [f_curr, function(x_next)], color=['red', 'green'])
plt.annotate('x_curr', (x_curr, f_curr), textcoords="offset points", xytext=(0,10), ha='center', fontsize=15, color='red')
plt.annotate('x_next', (x_next, function(x_next)), textcoords="offset points", xytext=(0,10), ha='center', fontsize=15, color='green')
plt.axhline(y=0, color='black', linewidth=0.8)
plt.axvline(x=0, color='black', linewidth=0.8)
plt.xlabel('x')
plt.ylabel('f(x)')
plt.legend()
plt.grid()
plt.title(f"Iteration {iter_count}")
plt.show()