import matplotlib.pyplot as plt
import numpy as npBisection Method
It is one of the Numerical Methods to find the approximate root of the function
Algorithm Steps:
- Choose an interval [a, b] where the function changes sign (f(a) * f(b) < 0).
- Calculate the midpoint c = (a + b) / 2.
- Evaluate the function at the midpoint, f(c).
- If f(c) is very close to zero or if the interval width is smaller than a specified tolerance, return c as the root.
- Determine which subinterval ([a, c] or [c, b]) has a sign change and adjust a or b accordingly.
- Repeat steps 2-5 until the interval width is smaller than the tolerance.
Import Libraries
Function to find the approx root
def bisection_method(func, a, b, tol=1e-6, max_iter=100):
    if func(a) * func(b) >= 0:
        raise ValueError("Function must have opposite signs at interval endpoints.")

    iter_count = 1
    prev_root = 0
    iteration_data = []

    print("Iteration |   a    |    b   |   c    |   Ea (%)   |   Et (%)")
    print("---------------------------------------------------------")

    while (b - a)> tol and iter_count < max_iter:
        c = (a + b) / 2


        Ea = abs((c - prev_root) / c) * 100
        iteration_data.append((iter_count, a, b, c, func(a), func(b), func(c)))
        Et = abs(func(c)) * 100
        print(f"{iter_count:9d} | {a:.4f} | {b:.4f} | {c:.4f} | {Ea:.6f} | {Et:.6f}")

        if func(c) == 0:
            return c
        elif func(c) * func(a) < 0:
            b = c
        else:
            a = c
        prev_root = c
        iter_count += 1

    return c,iteration_data
Defining the Fxn
def function(x):
    return x**3 - 4*x**2 + 7*x - 3
Initializing the variables
a = 0.0
b = 2.0
tolerance = 1e-6
FInding the approx value
root,iteration_data = bisection_method(function, a, b, tol=tolerance)
print("")
print("Approximate root:", root)
print("Function value at root:", function(root))
Iteration | a | b | c | Ea (%) | Et (%)
---------------------------------------------------------
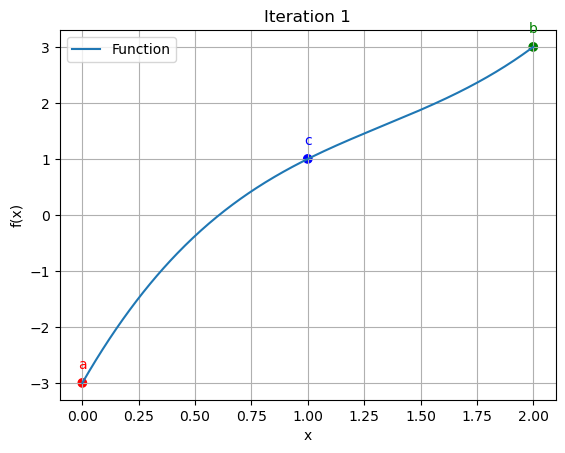
1 | 0.0000 | 2.0000 | 1.0000 | 100.000000 | 100.000000
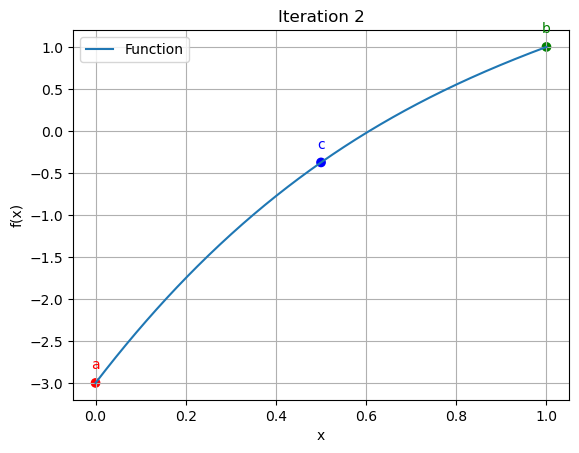
2 | 0.0000 | 1.0000 | 0.5000 | 100.000000 | 37.500000
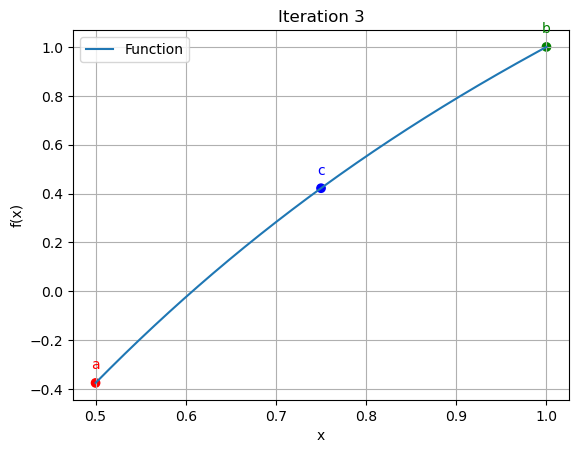
3 | 0.5000 | 1.0000 | 0.7500 | 33.333333 | 42.187500
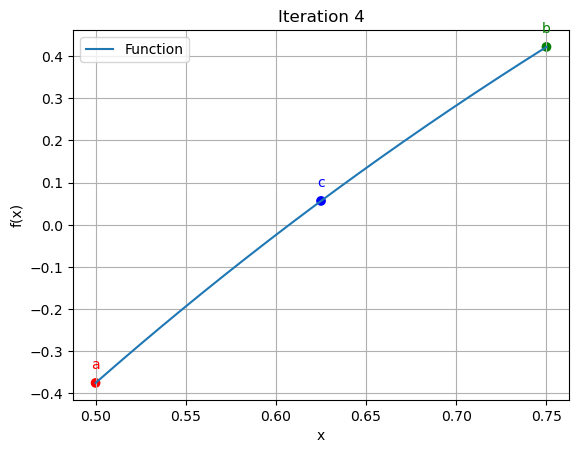
4 | 0.5000 | 0.7500 | 0.6250 | 20.000000 | 5.664062
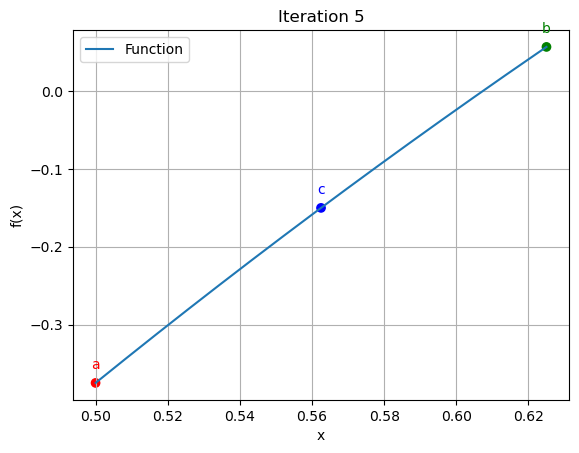
5 | 0.5000 | 0.6250 | 0.5625 | 11.111111 | 15.014648
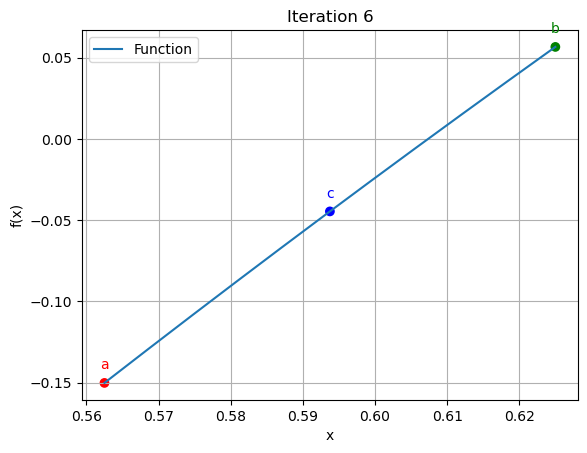
6 | 0.5625 | 0.6250 | 0.5938 | 5.263158 | 4.458618
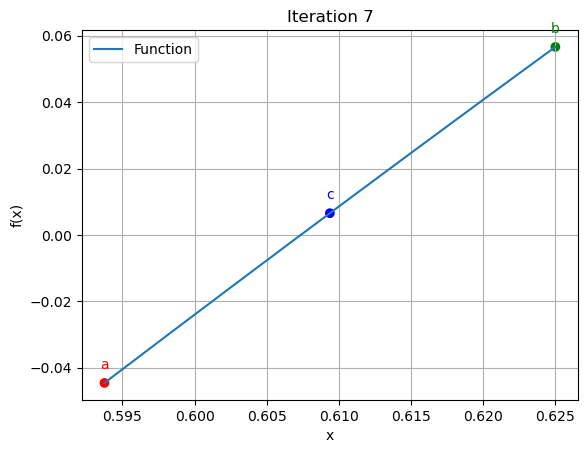
7 | 0.5938 | 0.6250 | 0.6094 | 2.564103 | 0.655746
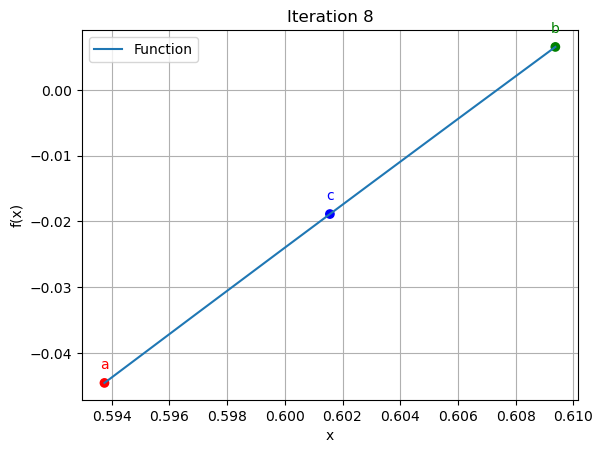
8 | 0.5938 | 0.6094 | 0.6016 | 1.298701 | 1.888037
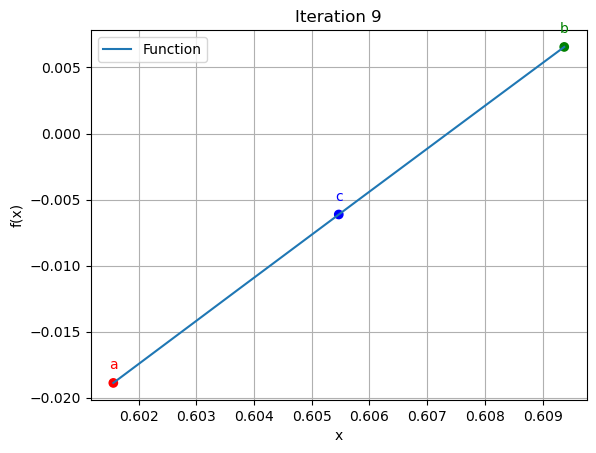
9 | 0.6016 | 0.6094 | 0.6055 | 0.645161 | 0.612813
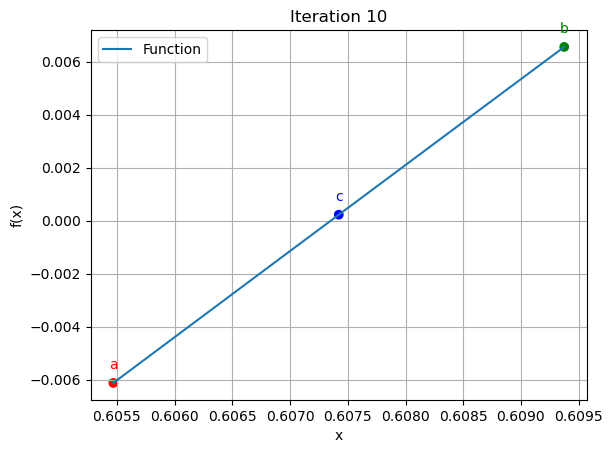
10 | 0.6055 | 0.6094 | 0.6074 | 0.321543 | 0.022297
11 | 0.6055 | 0.6074 | 0.6064 | 0.161031 | 0.295050
12 | 0.6064 | 0.6074 | 0.6069 | 0.080451 | 0.136324
13 | 0.6069 | 0.6074 | 0.6072 | 0.040209 | 0.057001
14 | 0.6072 | 0.6074 | 0.6073 | 0.020101 | 0.017348
15 | 0.6073 | 0.6074 | 0.6074 | 0.010049 | 0.002475
16 | 0.6073 | 0.6074 | 0.6073 | 0.005025 | 0.007436
17 | 0.6073 | 0.6074 | 0.6073 | 0.002512 | 0.002480
18 | 0.6073 | 0.6074 | 0.6074 | 0.001256 | 0.000003
19 | 0.6074 | 0.6074 | 0.6074 | 0.000628 | 0.001236
20 | 0.6074 | 0.6074 | 0.6074 | 0.000314 | 0.000617
21 | 0.6074 | 0.6074 | 0.6074 | 0.000157 | 0.000307
Approximate root: 0.6073541641235352
Function value at root: 3.0718599188794826e-06Plotting the values
for data in iteration_data[:10]:
    iter_count, a, b, c, f_a, f_b, f_c = data
    plt.figure()
    x_vals = np.linspace(a, b, 400)
    y_vals = function(x_vals)
    plt.plot(x_vals, y_vals, label='Function')
    plt.scatter([a, b, c], [function(a), function(b), function(c)], color=['red', 'green', 'blue'])
    plt.annotate('a', (a, function(a)), textcoords="offset points", xytext=(0,10), ha='center', fontsize=10, color='red')
    plt.annotate('b', (b, function(b)), textcoords="offset points", xytext=(0,10), ha='center', fontsize=10, color='green')
    plt.annotate('c', (c, function(c)), textcoords="offset points", xytext=(0,10), ha='center', fontsize=10, color='blue')
    plt.xlabel('x')
    plt.ylabel('f(x)')
    plt.legend()
    plt.grid()
    plt.title(f"Iteration {iter_count}")
    plt.show()